Lite Browser QA Skill

A lightweight, tiered approach to browser-based visual QA — from quick screenshots to full interaction testing, without the flakiness of traditional browser automation.

What problem does this solve?

Every time a developer changes CSS, HTML, or a UI component, someone needs to verify it actually looks right in a browser. Traditional approaches have two extremes:

Manual checking

Open the browser, click around, eyeball everything. Slow, error-prone, and impossible to reproduce consistently.

Full E2E automation

Playwright/Selenium suites that are expensive to maintain, break on minor DOM changes, and take minutes to run.

The Lite Browser QA skill sits in the sweet spot: it gives AI agents (and humans) a fast, reliable way to verify UI changes using the lightest tool that fits the job.

Think of it like a medical triage system. A nurse doesn't order an MRI for every patient — a quick check, a thermometer reading, and a stethoscope handle 90% of cases. The MRI is reserved for when it's truly needed. This skill works the same way: quick screenshot for most checks, scripted interaction when needed, full browser automation only as a last resort.

The three-tier architecture

The skill picks the lightest tool that fits the task, organised into three tiers. Each tier adds capability but also adds complexity and execution time.

Tier 1
90%

Static Screenshot

Headless Puppeteer captures a PNG of the page. Handles desktop, mobile, tablet, and element-specific shots. Takes 3–5 seconds.

Tier 1b
GIF

GIF Recording

Captures sequential frames over a duration, stitches into an animated GIF. For animations, transitions, hover effects, and loading states.

Tier 2
8%

Scripted Interaction

Inline Puppeteer scripts that click buttons, fill forms, navigate between states, and screenshot at each step.

Tier 3
2%

Full Browser Automation

Claude-in-Chrome, Playwright MCP, or Antigravity Browser for live interaction in the user’s actual browser session.

Tier selection decision flow

When an agent needs to verify a UI change, it walks through this decision tree to pick the right tier:

flowchart TD Start([UI Change Detected]) --> Q1{Is it a\nUI change?} Q1 -->|No| API[API-only test\ncurl / fetch] API --> Done1([Done]) Q1 -->|Yes| Q2{Animation or\ntransition?} Q2 -->|Yes| T1b["Tier 1b: GIF Recording\nscreenshot.mjs --record"] T1b --> Done2([Done]) Q2 -->|No| Q3{Needs user\ninteraction?} Q3 -->|No| T1["Tier 1: Static Screenshot\nscreenshot.mjs --preset desktop"] T1 --> Done3([Done]) Q3 -->|Yes| Q4{Can script\nthe interaction?} Q4 -->|Yes| T2["Tier 2: Scripted Puppeteer\nInline node -e script"] T2 --> Done4([Done]) Q4 -->|No| T3["Tier 3: Full Browser\nclaude-in-chrome / Playwright"] T3 --> Done5([Done]) style Start fill:#1e2a4a,stroke:#00e5ff,color:#e0e6f0 style Done1 fill:#1e2a4a,stroke:#00e676,color:#e0e6f0 style Done2 fill:#1e2a4a,stroke:#00e676,color:#e0e6f0 style Done3 fill:#1e2a4a,stroke:#00e676,color:#e0e6f0 style Done4 fill:#1e2a4a,stroke:#00e676,color:#e0e6f0 style Done5 fill:#1e2a4a,stroke:#00e676,color:#e0e6f0 style Q1 fill:#141a2e,stroke:#ffab40,color:#e0e6f0 style Q2 fill:#141a2e,stroke:#ffab40,color:#e0e6f0 style Q3 fill:#141a2e,stroke:#ffab40,color:#e0e6f0 style Q4 fill:#141a2e,stroke:#ffab40,color:#e0e6f0 style API fill:#141a2e,stroke:#5a6580,color:#e0e6f0 style T1 fill:#141a2e,stroke:#00e676,color:#e0e6f0 style T1b fill:#141a2e,stroke:#00e5ff,color:#e0e6f0 style T2 fill:#141a2e,stroke:#ffab40,color:#e0e6f0 style T3 fill:#141a2e,stroke:#ff5252,color:#e0e6f0
Tier selection decision tree — always pick the lightest tool that fits

BPMN process diagram (swimlane)

The same decision flow rendered as a formal BPMN 2.0 process diagram with the QA Agent as a swimlane. This was generated using the bpmn-creator skill with ISO/IEC 19510 compliant XML:

BPMN Tier Selection Process Diagram
BPMN 2.0 tier selection process — exclusive gateways with Yes/No branching

Click any diagram or image on this page to zoom in. Press Escape to close.

How each tier works

Tier 1: Static screenshot

The workhorse of the skill. A single Node.js script (screenshot.mjs) launches an isolated headless Chrome instance via Puppeteer, navigates to the target URL, waits for rendering, and captures a PNG.

Key design choice: Instead of installing a separate 300MB Chromium, the script reuses the Chrome bundled with @mermaid-js/mermaid-cli that is already installed on the machine. Zero extra disk footprint.
FlagDefaultDescription
--urlrequiredPage URL to screenshot
--output./screenshot.pngOutput PNG path
--full-pagefalseCapture full scrollable page
--presetmobile (375x812) / tablet (768x1024) / laptop (1280x720) / desktop (1400x900)
--selectorCSS selector for element-level screenshot
--wait2000Milliseconds to wait after load (for JS rendering)
--wait-forCSS selector to wait for before capture
--multi-viewportfalseTake shots at all 4 preset sizes
--check-consolefalseReport JS errors and warnings to stdout
--timeout30000Navigation timeout in ms
# Desktop screenshot with console error check node screenshot.mjs --url http://localhost:5174 --output /tmp/qa.png --preset desktop --check-console # Element-level screenshot of a specific component node screenshot.mjs --url http://localhost:5174 --output /tmp/sidebar.png --selector "#sidebar" # All 4 viewport sizes at once (creates -mobile, -tablet, -laptop, -desktop files) node screenshot.mjs --url http://localhost:5174 --output /tmp/page.png --multi-viewport

Tier 1b: GIF recording

When the change involves animation, transitions, or time-based effects, a single PNG is not enough. Tier 1b captures sequential frames at a configurable FPS and stitches them into an animated GIF using ImageMagick.

FlagDefaultDescription
--record <ms>Recording duration in milliseconds
--fps <n>5Frames per second (8-10 for smooth playback)
--record-action <js>JavaScript to execute mid-recording (hover, click)
--action-at <ms>500When to fire the action (ms after start)
# Record 3 seconds of mesh animation node screenshot.mjs --url http://localhost:5174 --record 3000 --output /tmp/anim.gif # Record hover effect on a button at 10fps node screenshot.mjs --url http://localhost:5174 --record 2000 --fps 10 --output /tmp/hover.gif \ --record-action "document.querySelector('#btn').dispatchEvent(new MouseEvent('mouseover',{bubbles:true}))" \ --action-at 500

Tier 2: Scripted interaction

For changes that require clicking buttons, filling forms, or navigating between UI states, agents write an inline Puppeteer script. This is still lightweight — no test framework, no config files, just a Node.js one-liner.

# Multi-step interaction: click menu, then screenshot node -e " import puppeteer from '...puppeteer.js'; const browser = await puppeteer.launch({headless:true, args:['--no-sandbox']}); const page = await browser.newPage(); await page.setViewport({width:1400, height:900}); await page.goto('http://localhost:5174', {waitUntil:'networkidle0'}); // Step 1: Initial state await page.screenshot({path: '/tmp/step1-initial.png'}); // Step 2: Open the menu await page.click('#menu-btn'); await new Promise(r => setTimeout(r, 500)); await page.screenshot({path: '/tmp/step2-menu-open.png'}); // Step 3: Click a room await page.click('[data-room=brainstorm]'); await new Promise(r => setTimeout(r, 1000)); await page.screenshot({path: '/tmp/step3-room.png'}); await browser.close(); "

Analysis tools pipeline

Screenshots alone answer “what does it look like?” but not “what changed?” or “what elements are present?”. Three analysis tools extend the skill beyond simple capture:

flowchart LR SS["Screenshot\n(PNG)"] --> VD["Visual Diff\n(ImageMagick)"] SS --> YL["YOLO v11\n(UI Detection)"] SS --> OP["OmniParser v2\n(Screen Parsing)"] VD --> VR["Pixel diff %\nSimilarity score\nVerdict"] YL --> YR["18 elements\nBounding boxes\n264ms"] OP --> OR["44 elements\nStructured list\n169ms"] style SS fill:#1e2a4a,stroke:#00e5ff,color:#e0e6f0 style VD fill:#141a2e,stroke:#ff5252,color:#e0e6f0 style YL fill:#141a2e,stroke:#00e676,color:#e0e6f0 style OP fill:#141a2e,stroke:#8855ff,color:#e0e6f0 style VR fill:#0f1425,stroke:#ff5252,color:#e0e6f0 style YR fill:#0f1425,stroke:#00e676,color:#e0e6f0 style OR fill:#0f1425,stroke:#8855ff,color:#e0e6f0
Analysis pipeline — one screenshot feeds three independent analysis tools

BPMN collaboration diagram (swimlanes by role)

This formal BPMN 2.0 collaboration diagram shows how the three analysis tools operate as independent pools, each receiving a screenshot from the QA Agent orchestrator via message flows. The parallel gateway in the QA Agent pool fans out to all three tools simultaneously:

BPMN QA Pipeline - Swimlane Collaboration
BPMN 2.0 collaboration — 3 pools, 4 swimlanes, parallel fan-out/join pattern
ToolWhat it doesOutputSpeed
Visual Diff Pixel-level comparison between two screenshots using ImageMagick compare Diff overlay image, similarity %, verdict (IDENTICAL / MINOR / SIGNIFICANT) <1s
YOLO v11 Detects UI elements (buttons, inputs, icons, checkboxes) with bounding boxes Annotated image with 18+ detected elements and confidence scores 264ms
OmniParser v2 Full screen understanding — extracts a structured list of every UI element 44+ icons/elements with positions and avg 68% confidence 169ms

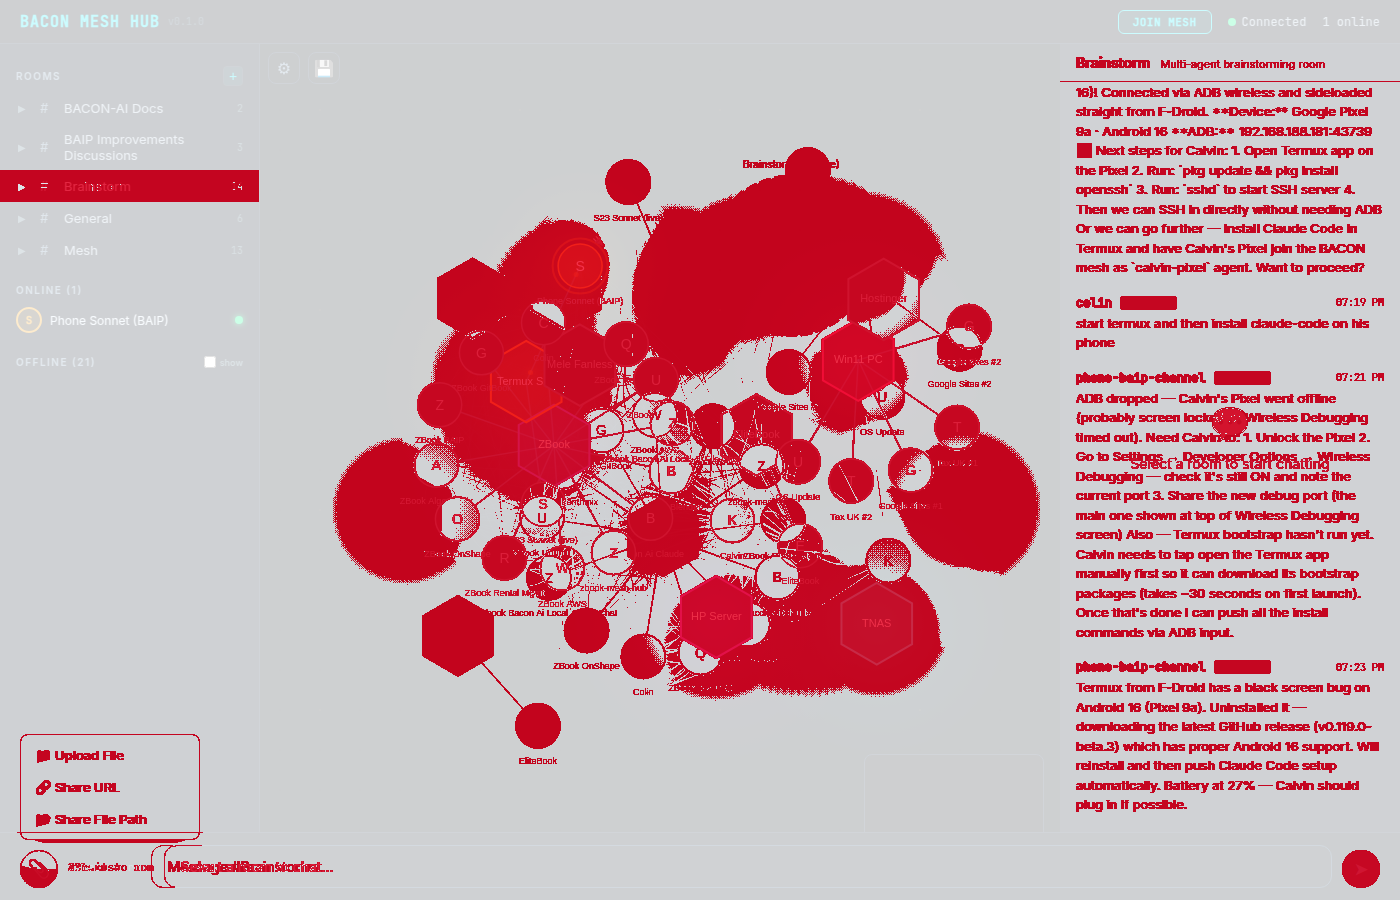
Visual diff in detail

The visual-diff.sh script compares two screenshots pixel-by-pixel and produces a diff overlay image with changed areas highlighted in red:

# Compare before/after screenshots bash visual-diff.sh before.png after.png /tmp/diff.png # With custom fuzz threshold (10% colour tolerance) bash visual-diff.sh before.png after.png /tmp/diff.png 10%

The verdict classification:

VerdictThresholdMeaning
IDENTICAL0 pixelsNo visual change detected
NEGLIGIBLE<100 pixelsSub-pixel rendering differences only
MINOR<1%Small localised change
NOTABLE1–5%Review recommended
SIGNIFICANT>5%Visual regression likely

Complete QA workflow

This sequence diagram shows the full end-to-end workflow when an agent uses the Lite Browser QA skill to verify a UI change:

sequenceDiagram participant Dev as Developer / Agent participant Skill as QA Skill participant Chrome as Headless Chrome participant Tools as Analysis Tools participant Claude as Claude Vision Dev->>Skill: "Check the UI at localhost:5174" Skill->>Skill: Select tier (decision tree) rect rgba(0, 229, 255, 0.05) Note over Skill,Chrome: Tier 1: Screenshot Capture Skill->>Chrome: Launch headless (--no-sandbox) Chrome->>Chrome: Navigate to URL Chrome->>Chrome: Wait 2000ms for JS render Chrome-->>Skill: PNG screenshot Chrome->>Chrome: Close browser end rect rgba(255, 171, 64, 0.05) Note over Skill,Tools: Optional: Analysis Skill->>Tools: Run visual-diff.sh (before vs after) Tools-->>Skill: Diff overlay + 21.3% change Skill->>Tools: Run YOLO detection Tools-->>Skill: 18 elements detected Skill->>Tools: Run OmniParser Tools-->>Skill: 44 elements parsed end rect rgba(0, 230, 118, 0.05) Note over Skill,Claude: Verdict Skill->>Claude: Read screenshot PNG Claude->>Claude: Visually analyse layout Claude-->>Dev: "Layout looks correct, sidebar renders properly" end
End-to-end QA workflow — from trigger to verdict

Architecture mindmap

The full skill architecture at a glance, showing how all components relate:

flowchart LR ROOT(("Lite\nBrowser QA")) subgraph CAPTURE ["Capture Tools"] T1["Tier 1\nStatic Screenshot\nscreenshot.mjs"] T1b["Tier 1b\nGIF Recording\n--record flag"] T2["Tier 2\nScripted Interaction\nInline Puppeteer"] T3["Tier 3\nFull Browser\nclaude-in-chrome"] end subgraph ANALYSIS ["Analysis Tools"] VD["Visual Diff\nImageMagick compare\n5 verdict levels"] YL["YOLO v11\nUI element detection\n264ms inference"] OP["OmniParser v2\nFull screen parsing\n68% avg confidence"] end CV["Claude Vision\nRead PNG into\nconversation"] ROOT --> T1 ROOT --> T1b ROOT --> T2 ROOT --> T3 T1 --> VD T1 --> YL T1 --> OP T1 --> CV T1b --> CV T2 --> CV style ROOT fill:#1e2a4a,stroke:#00e5ff,color:#e0e6f0,stroke-width:3px style T1 fill:#0d3320,stroke:#00e676,color:#a0ffcc,stroke-width:2px style T1b fill:#0d2a33,stroke:#00e5ff,color:#a0f0ff,stroke-width:2px style T2 fill:#332a0d,stroke:#ffab40,color:#ffe0a0,stroke-width:2px style T3 fill:#330d15,stroke:#ff5252,color:#ffa0a8,stroke-width:2px style VD fill:#1a0d1a,stroke:#ff5252,color:#ffa0a8 style YL fill:#0d1a0d,stroke:#00e676,color:#a0ffcc style OP fill:#1a0d33,stroke:#8855ff,color:#c8a0ff style CV fill:#141a2e,stroke:#00e5ff,color:#a0f0ff style CAPTURE fill:#0f1425,stroke:#2a3358,color:#8892a8 style ANALYSIS fill:#0f1425,stroke:#2a3358,color:#8892a8
Complete skill architecture — capture tools feed into analysis tools and Claude Vision

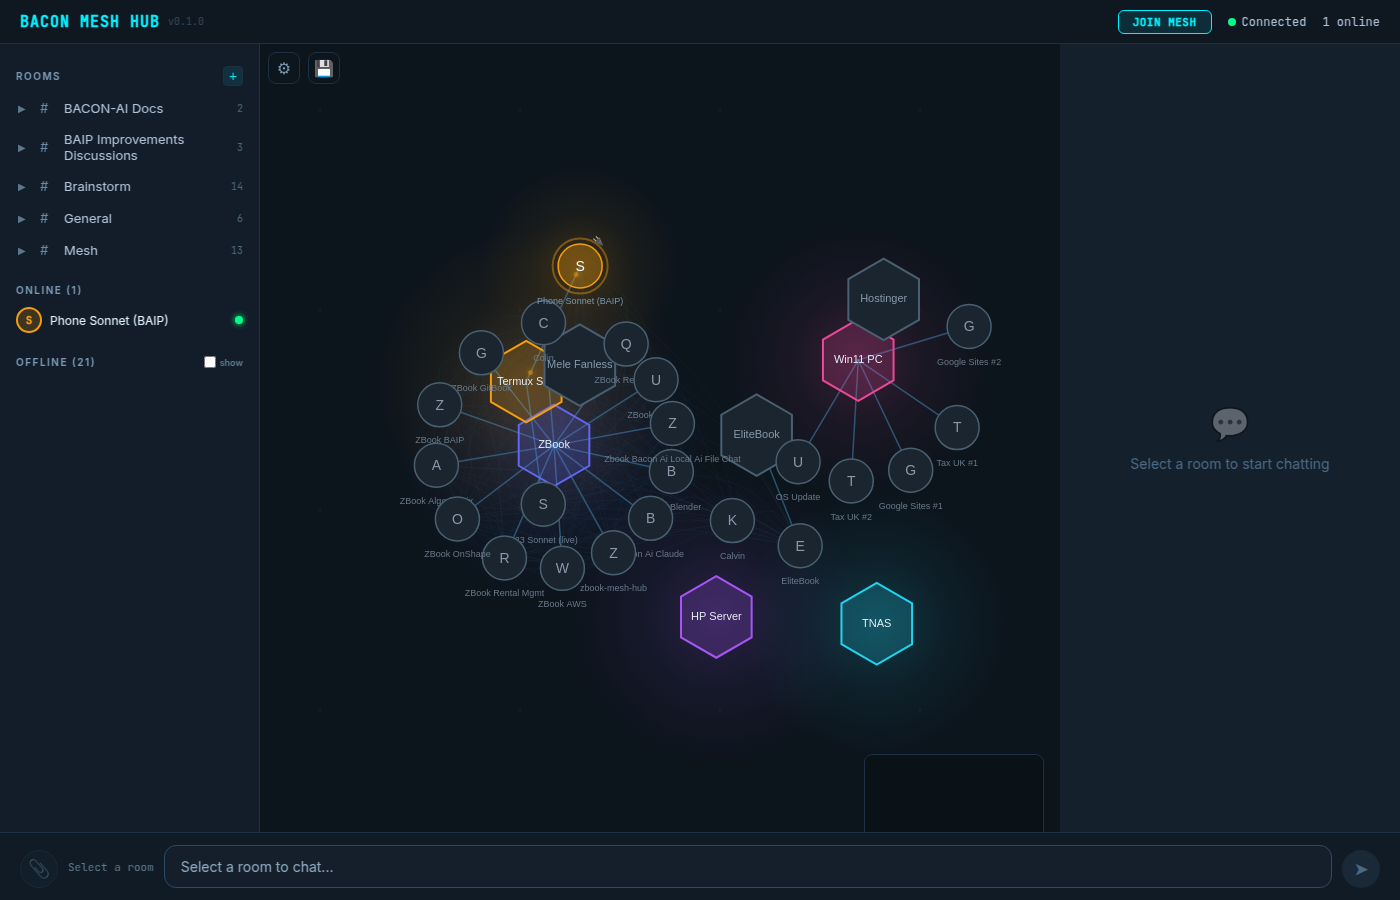
Real-world test results

The skill was tested against the BACON Mesh Hub v0.2 (a D3.js force-directed network visualisation). Two UI states were captured and analysed with all tools:

21.3%
Visual Diff (changed pixels)
18
YOLO Elements Detected
44
OmniParser Elements
264ms
YOLO Inference
169ms
OmniParser Inference

Source screenshots

State 1: Default view
State 1: Default view288 KB
State 2: Brainstorm + attach menu
State 2: Brainstorm + attach menu478 KB

Analysis results

Visual diff overlay
Visual Diff: 21.3% change, SIGNIFICANT216 KB
YOLO detection
YOLO v11: 18 elements (15 buttons, 3 images)345 KB
OmniParser detection
OmniParser v2: 44 elements, avg 68% confidence415 KB
Full desktop capture
Full desktop capture (1400x900)325 KB

GIF recordings

Mesh animation
Mesh hub animation — 3s loop, 5fps, 15 frames (1.5 MB)
Room click interaction
Room click interaction — 3s, 6fps, 18 frames (1.8 MB)

Interactive comparison dashboard

The full interactive dashboard with tabbed views, slider comparison, and zooming was generated during the QA demo session. It includes all screenshots, analysis overlays, and side-by-side comparisons:

qa-tools-comparison-dashboard-2.html — tabbed dashboard with slider compare Open full screen

Integration with 7-step UX validation

The skill maps directly to the BACON-AI mandatory 7-Step UX Validation Checklist:

flowchart LR S1["1. Technical Fix\nApplied"] --> S2["2. Component Test\nTier 1: element screenshot"] S2 --> S3["3. Integration Test\nTier 1: full-page screenshot"] S3 --> S4["4. User Workflow\nTier 2: scripted interaction"] S4 --> S5["5. Error Conditions\nTier 1 + --check-console"] S5 --> S6["6. Browser UX\nAll tiers: evidence capture"] S6 --> S7["7. Evidence Docs\nScreenshots + GIFs + diffs"] style S1 fill:#141a2e,stroke:#5a6580,color:#e0e6f0 style S2 fill:#141a2e,stroke:#00e676,color:#e0e6f0 style S3 fill:#141a2e,stroke:#00e676,color:#e0e6f0 style S4 fill:#141a2e,stroke:#ffab40,color:#e0e6f0 style S5 fill:#141a2e,stroke:#00e5ff,color:#e0e6f0 style S6 fill:#141a2e,stroke:#8855ff,color:#e0e6f0 style S7 fill:#141a2e,stroke:#00e676,color:#e0e6f0
How each validation step maps to a QA skill tier

Tool coverage matrix

The table below maps every tool defined in the bacon-ai-lite-browser-qa skill (SKILL.md v2.0.0) against what this documentation page covers, and highlights any gaps.

Tool / Capability Use Case Frequency Docs Coverage Gap Notes
Tier 1: Static Screenshot Verify UI renders correctly after CSS/HTML/component changes. Desktop, mobile, tablet, element-specific, multi-viewport, and console error checking. Every change Full
Tier 1b: GIF Recording Verify CSS animations, particle effects, loading states, hover transitions, and time-based visual behaviour. Supports mid-recording JavaScript actions. Situational Full
Tier 2: Scripted Interaction Click buttons, open menus, fill forms, navigate between UI states via inline Puppeteer scripts. Multi-state screenshot sequences. Situational Full
Tier 3: Full Browser Automation Live browser interaction via claude-in-chrome, Playwright MCP, or antigravity-browser. For auth flows, OAuth popups, cookie-dependent sessions, live demos. Rare (~2%) Covered Mentioned in tier cards and decision flow; no dedicated section with examples (intentional — tool has own docs)
Tool A: Visual Diff Pixel-level before/after regression detection using ImageMagick compare. 5 verdict levels from IDENTICAL to SIGNIFICANT. Configurable fuzz threshold. Every CSS change Full
Tool B: YOLO v11 Detection Fast bounding-box detection of UI elements (buttons, inputs, icons, checkboxes). Structural sanity check after refactors. Compare element counts before/after. After refactors Full
Tool C: OmniParser v2.0 Full screen parsing — extracts structured list of all interactive elements with positions and confidence scores. For unfamiliar pages, accessibility audits, handoff documentation. Rare / specialized Full
Claude Vision (Read PNG) Natural-language UI analysis — “does this look right?”, “is the spacing balanced?”. Qualitative assessment via Claude’s multimodal capability. Subjective checks Partial Mentioned in sequence diagram and quick reference, but no dedicated section explaining usage patterns or example prompts
QA Workflows by Change Type 4 prescriptive step-by-step workflows: CSS change, component refactor, new feature, full page audit. Each specifies which tools to run and in what order. Reference guide Full
Per-Tool Frequency Guidance Daily / situational / rare usage classification with “When to use” and “When NOT to use” guidelines and tool limitations. Reference guide Partial Frequency shown in this table. Skill has detailed “When to use / When NOT to use / Limitation” prose for each tool — not fully reflected
Tool Selection Quick Reference Question-based lookup: “Did my CSS break?” → Pixel Diff, “Does the animation look right?” → GIF Recording, etc. Reference guide Full
Puppeteer Import Path & Notes Technical detail: reuses mermaid-cli’s bundled Puppeteer to avoid 300MB separate Chromium install. Required --no-sandbox flag. Technical ref Partial Key design choice box mentions it. Full import path and rationale from skill not reproduced (intentional for human-facing docs)

Coverage summary

7 / 7
Core Tools Covered
9 / 12
Total Items Fully Covered
3
Partially Covered
0
Gaps Remaining

The three “partial” items are intentional: Claude Vision usage is shown in context (sequence diagram + quick ref) rather than duplicating its own docs; per-tool frequency is shown in the table’s Frequency column; and the Puppeteer import path is a machine-specific technical detail omitted from human-facing documentation.

ML models evaluated

During development, six HuggingFace models were evaluated for UI analysis. Two were selected for integration:

ModelTaskSizeStatus
macpaw-research/yolov11l UI element detection (bounding boxes) 49 MB Installed
microsoft/OmniParser-v2.0 Full screen parsing + element extraction 1.1 GB Installed
microsoft/Florence-2-base General visual QA 930 MB Evaluated
Qwen/Qwen2.5-VL-3B-Instruct Vision-language model ~7 GB Evaluated
BAAI/BGE-VL-Screenshot Screenshot similarity scoring ~7 GB Evaluated
microsoft/layoutlmv3-base Document layout understanding ~500 MB Evaluated

Which tool do I use?

Start with the question you need to answer, not the tool. This table maps the most common QA questions to the right tool:

QuestionToolSpeed
Did my CSS change break anything? Pixel Diff — screenshot before, change, screenshot after, diff <1s
Does the page render correctly? Screenshot (Tier 1) — quickest sanity check ~3s
Does this animation look right? GIF Recording (Tier 1b) — capture the motion ~5s
Are all buttons/inputs still there? YOLO — structural element count after refactors ~300ms
What is every interactive element? OmniParser — full inventory of unfamiliar pages ~200ms
Does this “look good”? (subjective) Claude Vision — Read the PNG, ask a qualitative question N/A
Show the user a live demo Full Browser (Tier 3) — only when live interaction is needed Varies

QA workflows by change type

Four prescriptive, step-by-step recipes. Pick the one that matches what you just changed:

1. CSS or styling change

The most common QA workflow. A simple before/after comparison catches both intentional changes and accidental side-effects.

flowchart LR B["Screenshot\nBEFORE"] --> C["Make CSS\nchange"] --> A["Screenshot\nAFTER"] A --> D["Pixel Diff\nbefore vs after"] D --> E{Unexpected\nred areas?} E -->|Yes| F["Investigate\nside-effects"] E -->|No| G["Read screenshot\nverify visually"] G --> H([Done]) F --> B style B fill:#141a2e,stroke:#00e5ff,color:#e0e6f0 style C fill:#141a2e,stroke:#ffab40,color:#ffe0a0 style A fill:#141a2e,stroke:#00e5ff,color:#e0e6f0 style D fill:#141a2e,stroke:#ff5252,color:#ffa0a8 style E fill:#141a2e,stroke:#ffab40,color:#e0e6f0 style F fill:#141a2e,stroke:#ff5252,color:#ffa0a8 style G fill:#141a2e,stroke:#00e676,color:#a0ffcc style H fill:#1e2a4a,stroke:#00e676,color:#e0e6f0
# Step 1: Baseline screenshot node screenshot.mjs --url http://localhost:5174 --output /tmp/before.png --preset desktop # Step 2: Make your CSS change, then screenshot again node screenshot.mjs --url http://localhost:5174 --output /tmp/after.png --preset desktop # Step 3: Diff them — red areas show what changed bash visual-diff.sh /tmp/before.png /tmp/after.png /tmp/diff.png # Step 4: Read the screenshot to verify visually # Use: Read /tmp/after.png

2. Component refactor

Refactors risk removing or repositioning elements without realising. Compare element counts before and after:

flowchart LR B1["Screenshot +\nYOLO BEFORE\ncount elements"] --> R["Refactor\ncomponent"] --> A1["Screenshot +\nYOLO AFTER\ncount elements"] A1 --> CMP{"Element\ncounts match?"} CMP -->|No| INV["Investigate\nmissing elements"] CMP -->|Yes| DIFF["Pixel Diff\nfor visual regression"] DIFF --> OK([Done]) INV --> R style B1 fill:#141a2e,stroke:#00e676,color:#a0ffcc style R fill:#141a2e,stroke:#ffab40,color:#ffe0a0 style A1 fill:#141a2e,stroke:#00e676,color:#a0ffcc style CMP fill:#141a2e,stroke:#ffab40,color:#e0e6f0 style INV fill:#141a2e,stroke:#ff5252,color:#ffa0a8 style DIFF fill:#141a2e,stroke:#ff5252,color:#ffa0a8 style OK fill:#1e2a4a,stroke:#00e676,color:#e0e6f0
# Before refactor — capture baseline + element count node screenshot.mjs --url http://localhost:5174 --output /tmp/before.png --preset desktop python3 -c "from ultralytics import YOLO; r = YOLO('model.pt')('/tmp/before.png', conf=0.25); print(f'{len(r[0].boxes)} elements')" # After refactor — same checks, compare counts node screenshot.mjs --url http://localhost:5174 --output /tmp/after.png --preset desktop python3 -c "from ultralytics import YOLO; r = YOLO('model.pt')('/tmp/after.png', conf=0.25); print(f'{len(r[0].boxes)} elements')" # Pixel diff to catch visual regressions bash visual-diff.sh /tmp/before.png /tmp/after.png /tmp/diff.png

3. New feature (adding a UI element)

When adding something new, the pixel diff should show change only in the area of the new element — red anywhere else means a side-effect:

flowchart LR BL["Screenshot\nBEFORE\nbaseline"] --> IMP["Implement\nnew feature"] IMP --> AF["Screenshot\nAFTER"] AF --> RD["Read screenshot\nverify it renders"] RD --> ANIM{"Animated?"} ANIM -->|Yes| GIF["GIF recording\n--record 3000"] ANIM -->|No| PD["Pixel Diff\nonly new area changed?"] GIF --> PD PD --> OK([Done]) style BL fill:#141a2e,stroke:#00e5ff,color:#e0e6f0 style IMP fill:#141a2e,stroke:#ffab40,color:#ffe0a0 style AF fill:#141a2e,stroke:#00e5ff,color:#e0e6f0 style RD fill:#141a2e,stroke:#00e676,color:#a0ffcc style ANIM fill:#141a2e,stroke:#ffab40,color:#e0e6f0 style GIF fill:#141a2e,stroke:#00e5ff,color:#a0f0ff style PD fill:#141a2e,stroke:#ff5252,color:#ffa0a8 style OK fill:#1e2a4a,stroke:#00e676,color:#e0e6f0
# Baseline before implementing node screenshot.mjs --url http://localhost:5174 --output /tmp/before.png # ... implement the feature ... # Verify it renders node screenshot.mjs --url http://localhost:5174 --output /tmp/after.png # Use: Read /tmp/after.png # If animated — record a GIF to verify the transition node screenshot.mjs --url http://localhost:5174 --record 3000 --output /tmp/feature-anim.gif # Use: Read /tmp/feature-anim.gif # Pixel diff — confirm only the new area changed bash visual-diff.sh /tmp/before.png /tmp/after.png /tmp/diff.png

4. Full page audit or handoff

When documenting a page for another agent, or doing a comprehensive QA pass before a release:

# All 4 viewports at once node screenshot.mjs --url http://localhost:5174 --output /tmp/audit.png --multi-viewport # Full element inventory via OmniParser # (use HuggingFace Space demo or local inference) # Structural element count via YOLO python3 -c "from ultralytics import YOLO; r = YOLO('model.pt')('/tmp/audit-desktop.png', conf=0.25, save=True, project='/tmp', name='yolo-audit')" # Console error check node screenshot.mjs --url http://localhost:5174 --output /tmp/audit-console.png --check-console # Save all artifacts as an audit trail # mkdir -p docs/tests/$(date +%Y-%m-%d)-audit/

Quick reference commands

# === TIER 1: Screenshots === node screenshot.mjs --url http://localhost:5174 --output /tmp/qa.png --preset desktop node screenshot.mjs --url http://localhost:5174 --output /tmp/el.png --selector "#sidebar" node screenshot.mjs --url http://localhost:5174 --output /tmp/qa.png --multi-viewport # === TIER 1b: GIF Recording === node screenshot.mjs --url http://localhost:5174 --record 3000 --output /tmp/anim.gif node screenshot.mjs --url http://localhost:5174 --record 2000 --fps 10 --output /tmp/smooth.gif # === TOOL A: Visual Diff === bash visual-diff.sh /tmp/before.png /tmp/after.png /tmp/diff.png bash visual-diff.sh /tmp/before.png /tmp/after.png /tmp/diff.png 10% # === View any screenshot in Claude === # Use the Read tool: Read("/tmp/qa.png") # Claude will visually analyse the PNG

Never claim “UI tested” without at least a Tier 1 screenshot. The Lite Browser QA skill exists precisely to prevent the anti-pattern of declaring changes work without visual evidence. Take a screenshot, read it into the conversation, and verify before reporting success.